Announcing new features to boost LRU cache performance
Explore the benefits and implementation of this innovative update for optimal database efficiency.
Aerospike Database 7.1 introduces a new innovative feature that will be highly beneficial for users deploying Aerospike as a least recently used (LRU) cache. In this blog post, we will explore this straightforward enhancement to the server that will significantly boost the performance of your LRU cache. However, before delving into the details, let’s first examine what an LRU cache is and how it can be implemented using a simple data modeling technique.
What is an LRU cache?
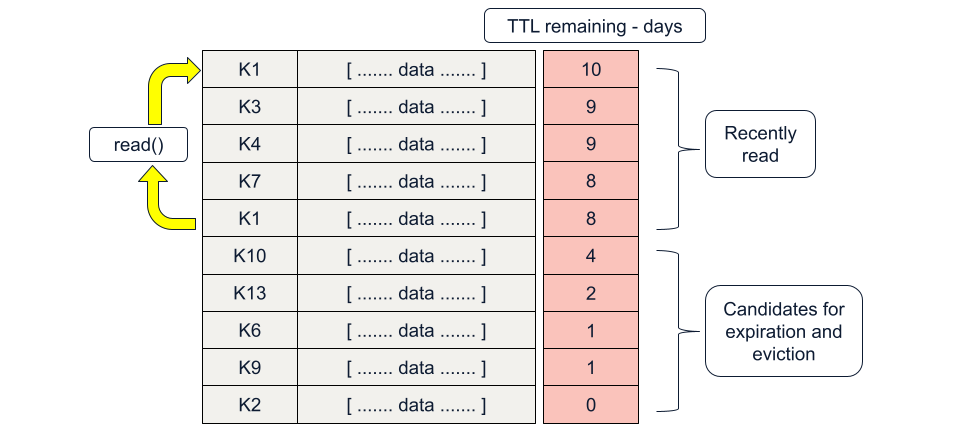
With an LRU cache, records that are not being read (used) should be removed, and records that are being recently read should be kept.
LRU in the Aerospike data model
Aerospike lets users define a time-to-live (TTL) for each record. It's a future timestamp (the void-time) from the instant a record is created or updated in Aerospike. When the server clock advances to this record void-time, the record expires and is automatically removed from the server.
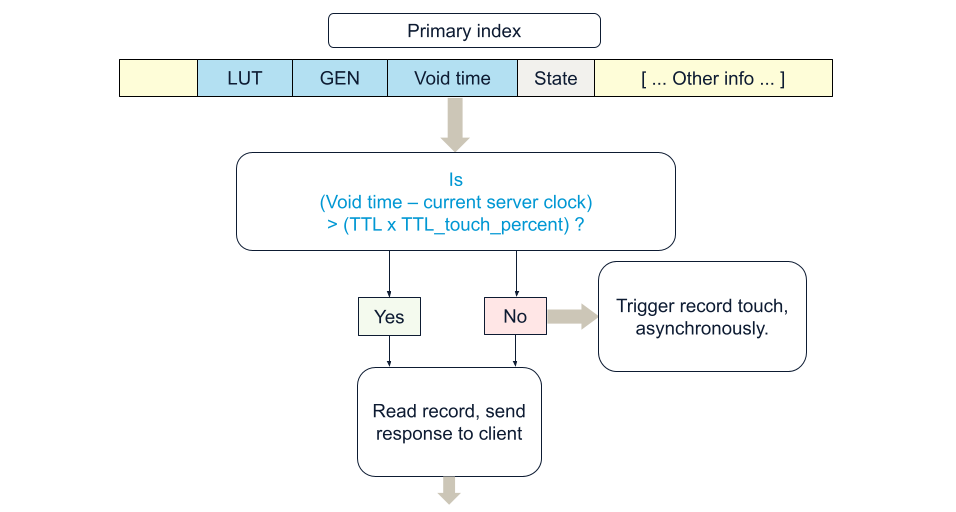
To further optimize storage, the server can automatically remove records with the least time left to live when storage reaches a defined threshold. This is referred to as "eviction" in Aerospike. As shown in the figure above, other elements in the record metadata are LUT—last update time and GEN—the record generation, which starts at one and increments every time the record is updated, eventually rolling back to 1.
Ways to avoid replication delay in an LRU model
Since this is a cache, there is persistent data elsewhere. When a record is not found in the cache, a cache miss, it is retrieved from a persistent store with slower access, served to the application, and a copy saved in the LRU cache for future reads of the same record.
Therefore, one may argue that in this particular use case, especially for short TTL use cases, one could deploy with replication factor (RF) = 1. Should a node go down, the data would be replenished from the persistent store. For some use cases, this occasional slowdown in performance may never be acceptable, and users may still want to operate with RF=2.
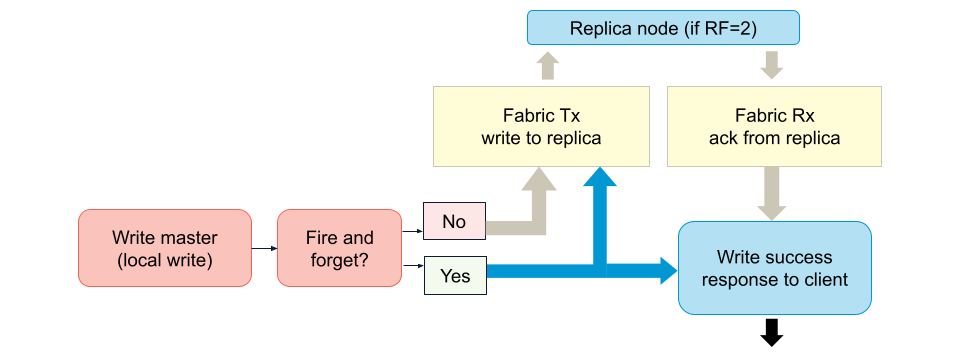
If you must operate with RF=2 and are using AP mode, another option is to speed up replica writes, colloquially referred to as the fire-and-forget mode. This is enabled by setting the server configuration write-commit-level-override to "master" from its default "off" value. In this mode, the master node handling the write does not hold the transaction waiting to receive the replica write acknowledgment from the replica node; hence, it is referred to as fire-and-forget.
Regardless, every read still requires an additional write operation to implement an LRU cache. From a code perspective, this can be implemented using the operate() API, where we precede each read() by a touch() operation.
The touch() operation extends the TTL to the namespace/set default value of this recently-read record. It can also set the TTL to a custom value via the WritePolicy.
Unread records will move closer to expiration and are picked up by the namespace supervisor thread as candidates for expiration. If they hit the storage threshold, they become candidates for eviction.
The downside in this application side LRU cache implementation is that every read also entails a write.
Aerospike 7.1 to the rescue!
Ideally, we would like to keep reading the records, and only when their remaining TTL ( = void-time – current server clock) is approaching a desired threshold would we do a single write that extends the TTL to a new void-time. Thereafter, we want to continue with regular reads.
In version 7.1, we can define this threshold as a percentage of the default TTL. For example, if the default TTL is ten days, and we define the percent value as 80, for the first two days of this record, we will do normal reads. When eight days remain (80% of its original life), the next read will trigger a touch operation. This will put the record TTL back to ten days, and we will again do pure reads for the next two days. A subsequent read after two days will again trigger a touch and replenish the record TTL to a new void-time.
This new feature in version 7.1 will allow users to configure their namespace so that the read will asynchronously trigger a touch when the remaining TTL reaches the desired threshold. Since the touch is triggered asynchronously in the server, the replication delay does not hold back the read transaction.

Configuring Aerospike to trigger touch on reads
A namespace configuration parameter, default-read-touch-ttl-pct has been added.
Set level configuration granularity: When default-read-touch-ttl-pct is defined at the namespace level, it is inherited by each set in the namespace. Setting default-read-touch-ttl-pct to 0 (default) in the set context implies using the namespace value. Setting to a number greater than zero overrides the namespace value for records in this set. Setting it to -1 disables the touch trigger for all records in this set.
Furthermore, if desired, the touch can override the namespace default-ttl value (a set level default-ttl is also available, overriding the namespace default TTL) via the write policy and use the most recent write’s TTL to extend the record’s life.
Configuration example
Relevant server configuration settings in the configuration file, typically at: /etc/aerospike/aerospike.conf
Here, we are using default-read-touch-ttl-pct 0 (disabled) at namespace (test) level and overriding it at the set (testset) level to 80 percent, for records in this set only.
namespace test {
        default-ttl 30s # use 0 to never expire/evict.
        default-read-touch-ttl-pct 0
        set testset {
          default-read-touch-ttl-pct 80
        }
        nsup-period 120
        replication-factor 1
        storage-engine device {
                file /opt/aerospike/data/test.dat
                filesize 4G
         }
}
Namespace configuration for default-read-touch-ttl-pct for namespace test can be viewed in asadm as follows:
Admin> show config namespace for test like touch
~test Namespace Configuration (2024-05-10 04:30:12 UTC)~
Node                      |5bdcafdbee54:3000
default-read-touch-ttl-pct|0
Number of rows: 2
Set level configuration parameters can be viewed using asinfo via asadm in admin mode or on the shell prompt (they are not available in Admin>show config).
Admin> enable
Admin+> asinfo -v "sets/test/testset"
5bdcafdbee54:3000 (172.17.0.2) returned:
objects=0:tombstones=0:data_used_bytes=0:truncate_lut=0:sindexes=1:index_populating=false:truncating=false:default-read-touch-ttl-pct=80:default-ttl=0:disable-eviction=false:enable-index=false:stop-writes-count=0:stop-writes-size=0;
Or at the shell prompt as:
root@5bdcafdbee54:/# asinfo -v "sets/test/testset"
objects=0:tombstones=0:data_used_bytes=0:truncate_lut=0:sindexes=1:index_populating=false:truncating=false:default-read-touch-ttl-pct=80:default-ttl=0:disable-eviction=false:enable-index=false:stop-writes-count=0:stop-writes-size=0;
In short, users have various levels of control, both from the client side and server configuration side, to implement the touch trigger as selectively as they desire.
Client side policy
Client side Policy, that applies to both reads and writes, now has a new attribute: readTouchTtlPercent. This can be used to override the server defaults on a per transaction basis. A value from 1 to 100 would be the percent value to use, overriding the server default. Setting a value of 0 will use the server default value. Using readTouchTtlPercent to -1 in a read transaction will disable triggering a touch operation and the record void-time will not be updated.
Read transaction example
Policy rPolicy = new Policy();
rPolicy.readTouchTtlPercent = 80;  //Overrides namespace or set configuration default-read-touch-ttl-pct value.
Key myKey1 = new Key("test", "testset", Value.get("key1"));
System.out.println("Rec read: "+ client.get(rPolicy, myKey1));
Can we do this in Batch reads too? Absolutely yes!
Batch read example
BatchPolicy batchPolicy = new BatchPolicy();
batchPolicy.readTouchTtlPercent = 0;   //Use server default
Key key1 = new Key("test", "testset", Value.get("key1"));
Key key2 = new Key("test", "testset", Value.get("key2"));
Key key3 = new Key("test", "testset", Value.get("key3"));
Key key4 = new Key("test", "testset", Value.get("key4"));
Record [] bReads = client.get(batchPolicy, new Key[] {key1, key2, key3, key4});
// process the batch reads
for (int i = 0; i < bReads.length; i++) {
Record bRead = bReads[i];
if (bRead != null) { // check individual record
System.out.format("Result[%d]: ",i);
System.out.println(bRead);
}
else { //Record not found returns null
System.out.format("Record[%d] not found. \n", i);
}
}Other transactions
Other types of transactions such as basic queries and scans, or writes that turn into a read transaction due to expression filters or UDFs will not trigger touch.
Essentially, only reads or batch reads can exploit this feature.
Reading from replicas?
Since Aerospike only writes to master, how does this work when reads that are allowed from replicas? Well, for the occasional case where the read must trigger a touch, the entire read request will be proxied to the master by the server. That occasional read from replica, in this special case, will be slightly slower compared to the other regular reads that are not triggering the touch and are being served by the replica.
AP vs. SC (strong consistency) mode
LRU cache will commonly be deployed in the AP mode (prefer availability during partitioning events). It is serving fast reads of data otherwise stored elsewhere with slower access, and, while the data's life is extended upon read in the cache, the data itself is not typically updated. Hence, strong consistency is not a concern. However, nothing prevents users from implementing this feature in SC Mode. Of course, SC mode will have to be configured to allow records with finite TTL.
Metrics and logging
A new set of metrics and histograms are available to track the touch trigger as well as read_touch log entries.
New metrics
read_touch_tsvc_error
read_touch_tsvc_timeout
read_touch_success
read_touch_error
read_touch_timeout
read_touch_skip
The first 5 above are familiar results for internal transactions (e.g. re-replications).
read_touch_skip indicates how many touches are abandoned upon finding that another write (including an earlier touch) has taken place or is taking place, removing the need to proceed with the touch.
New log ticker line:
{ns-name} read-touch: tsvc (0,0) all-triggers (12345,0,3,45)The numbers in parentheses are the above listed metrics, in the order listed.
tsvc(read_touch_tsvc_error,read_touch_tsvc_timeout)
all-triggers(read_touch_success, read_touch_error, read_touch_timeout, read_touch_skip)
Corresponding to above example, in the logs we see:
May 10 2024 03:45:43 GMT: INFO (info): (ticker.c:1017) {test} read-touch: tsvc (0,0) all-triggers (100,0,0,0)and,
May 10 2024 03:45:43 GMT: INFO (info): (hist.c:320) histogram dump: {test}-read-touch (100 total) msecStatistics viewed using asadm
$ asadm
Admin> show statistics namespace for test like read_touch
~test Namespace Statistics (2024-05-10 03:42:51 UTC)~
Node                   |5bdcafdbee54:3000
read_touch_error       |0
read_touch_skip        |0
read_touch_success     |100
read_touch_timeout     |0
read_touch_tsvc_error  |0
read_touch_tsvc_timeout|0
Number of rows: 7
Finally, latencies can be viewed via asadm of asinfo which will show the {namespace-name}-read-touch histogram.
$ asinfo -v "latencies:hist={test}-read-touch"
{test}-read-touch:msec,0.0,0.00,0.00,0.00,0.00,0.00,0.00,0.00,0.00,0.00,0.00,0.00,0.00,0.00,0.00,0.00,0.00,0.00
or for all nodes
$ asadm --enable -e 'asinfo -v "latencies:hist={test}-read-touch"'75399b585f20:3000 (172.17.0.2) returned:
{test}-read-touch:msec,0.0,0.00,0.00,0.00,0.00,0.00,0.00,0.00,0.00,0.00,0.00,0.00,0.00,0.00,0.00,0.00,0.00,0.00
We don't expect many users querying for this histogram, but it's there should you need it.
Get started
This simple server enhancement should make users deploying Aerospike as an LRU cache jump for joy! It's fairly easy to deploy with minimal code or configuration changes and will greatly reduce unnecessary writes on every read for LRU cache implementations.

