Query tracing
Overview
Query Tracing is a feature to trace Gremlin queries in AGS. By logging query attributes such as query structure, execution steps, and time taken at each stage, it helps users diagnose query performance issues and pinpoint performance bottlenecks for optimization.
When to use Query Tracing?
Query Tracing is a valuable tool for diagnosing and optimizing query performance. It is best suited for testing and debugging rather than continuous production use, as it may introduce a minor performance impact.
Use Query Tracing in the following scenarios:
Identifying slow queries – Automatically detect queries that exceed a predefined SLA without manual intervention.
Debugging query performance issues – Analyze query structure and execution paths to pinpoint inefficiencies.
Optimizing query efficiency – Test different query patterns to determine the most effective approach for performance improvement
How it works
When you enable Query Tracing, AGS automatically collects traces of queries that take longer than the configured threshold. The traces can by viewed with Zipkin, an open-source distributed tracing system.
Setup and usage
Start Zipkin
Zipkin is an open-source distributed tracing system. You can run Zipkin in various ways as described in their documentation, The procedure described here uses Docker.
Start Zipkin in a Docker container:
docker run -d --name ags-zipkin -p 9411:9411 openzipkin/zipkin:latestConfigure AGS
To use query tracing, configure the following AGS options:
aerospike.graph.query-tracing.threshold-msThreshold in milliseconds above which queries are traced. Set this option to a positive integer to enable slow query tracing. Defaults to
-1(disabled).aerospike.graph.query-tracing.sampling-percentagePercentage of queries that exceed the slow query tracing threshold to be traced. Defaults to
100.aerospike.graph.query-tracing.opentelemetry-hostHost IP for Zipkin. Defaults to
localhost.aerospike.graph.query-tracing.opentelemetry-portPort number for Zipkin. Defaults to
9411.aerospike.graph.script-logging.redact-literalsWhen enabled, sensitive or literal data within queries (such as IDs, labels, etc) are redacted from the logs for security and privacy reasons. Defaults to
false.
Start AGS
Start AGS in a Docker container. See Deploying AGS for details. When query tracing is enabled, AGS performs a health check to the Zipkin endpoint on start-up. If configured improperly, AGS fails to start with additional details noted in the AGS logs.
Once AGS is running, any queries which run for longer than the threshold set in the
aerospike.graph.query-tracing.threshold-msoption appear in the Zipkin UI. Access the Zipkin UI athttp://<zipkin-host>:<zipkin-port>.
Example setup
Access the Zipkin UI at http://<zipkin-host-ip>:<zipkin-port> as specified in the
configuration options. The default address is
http://localhost:9411.
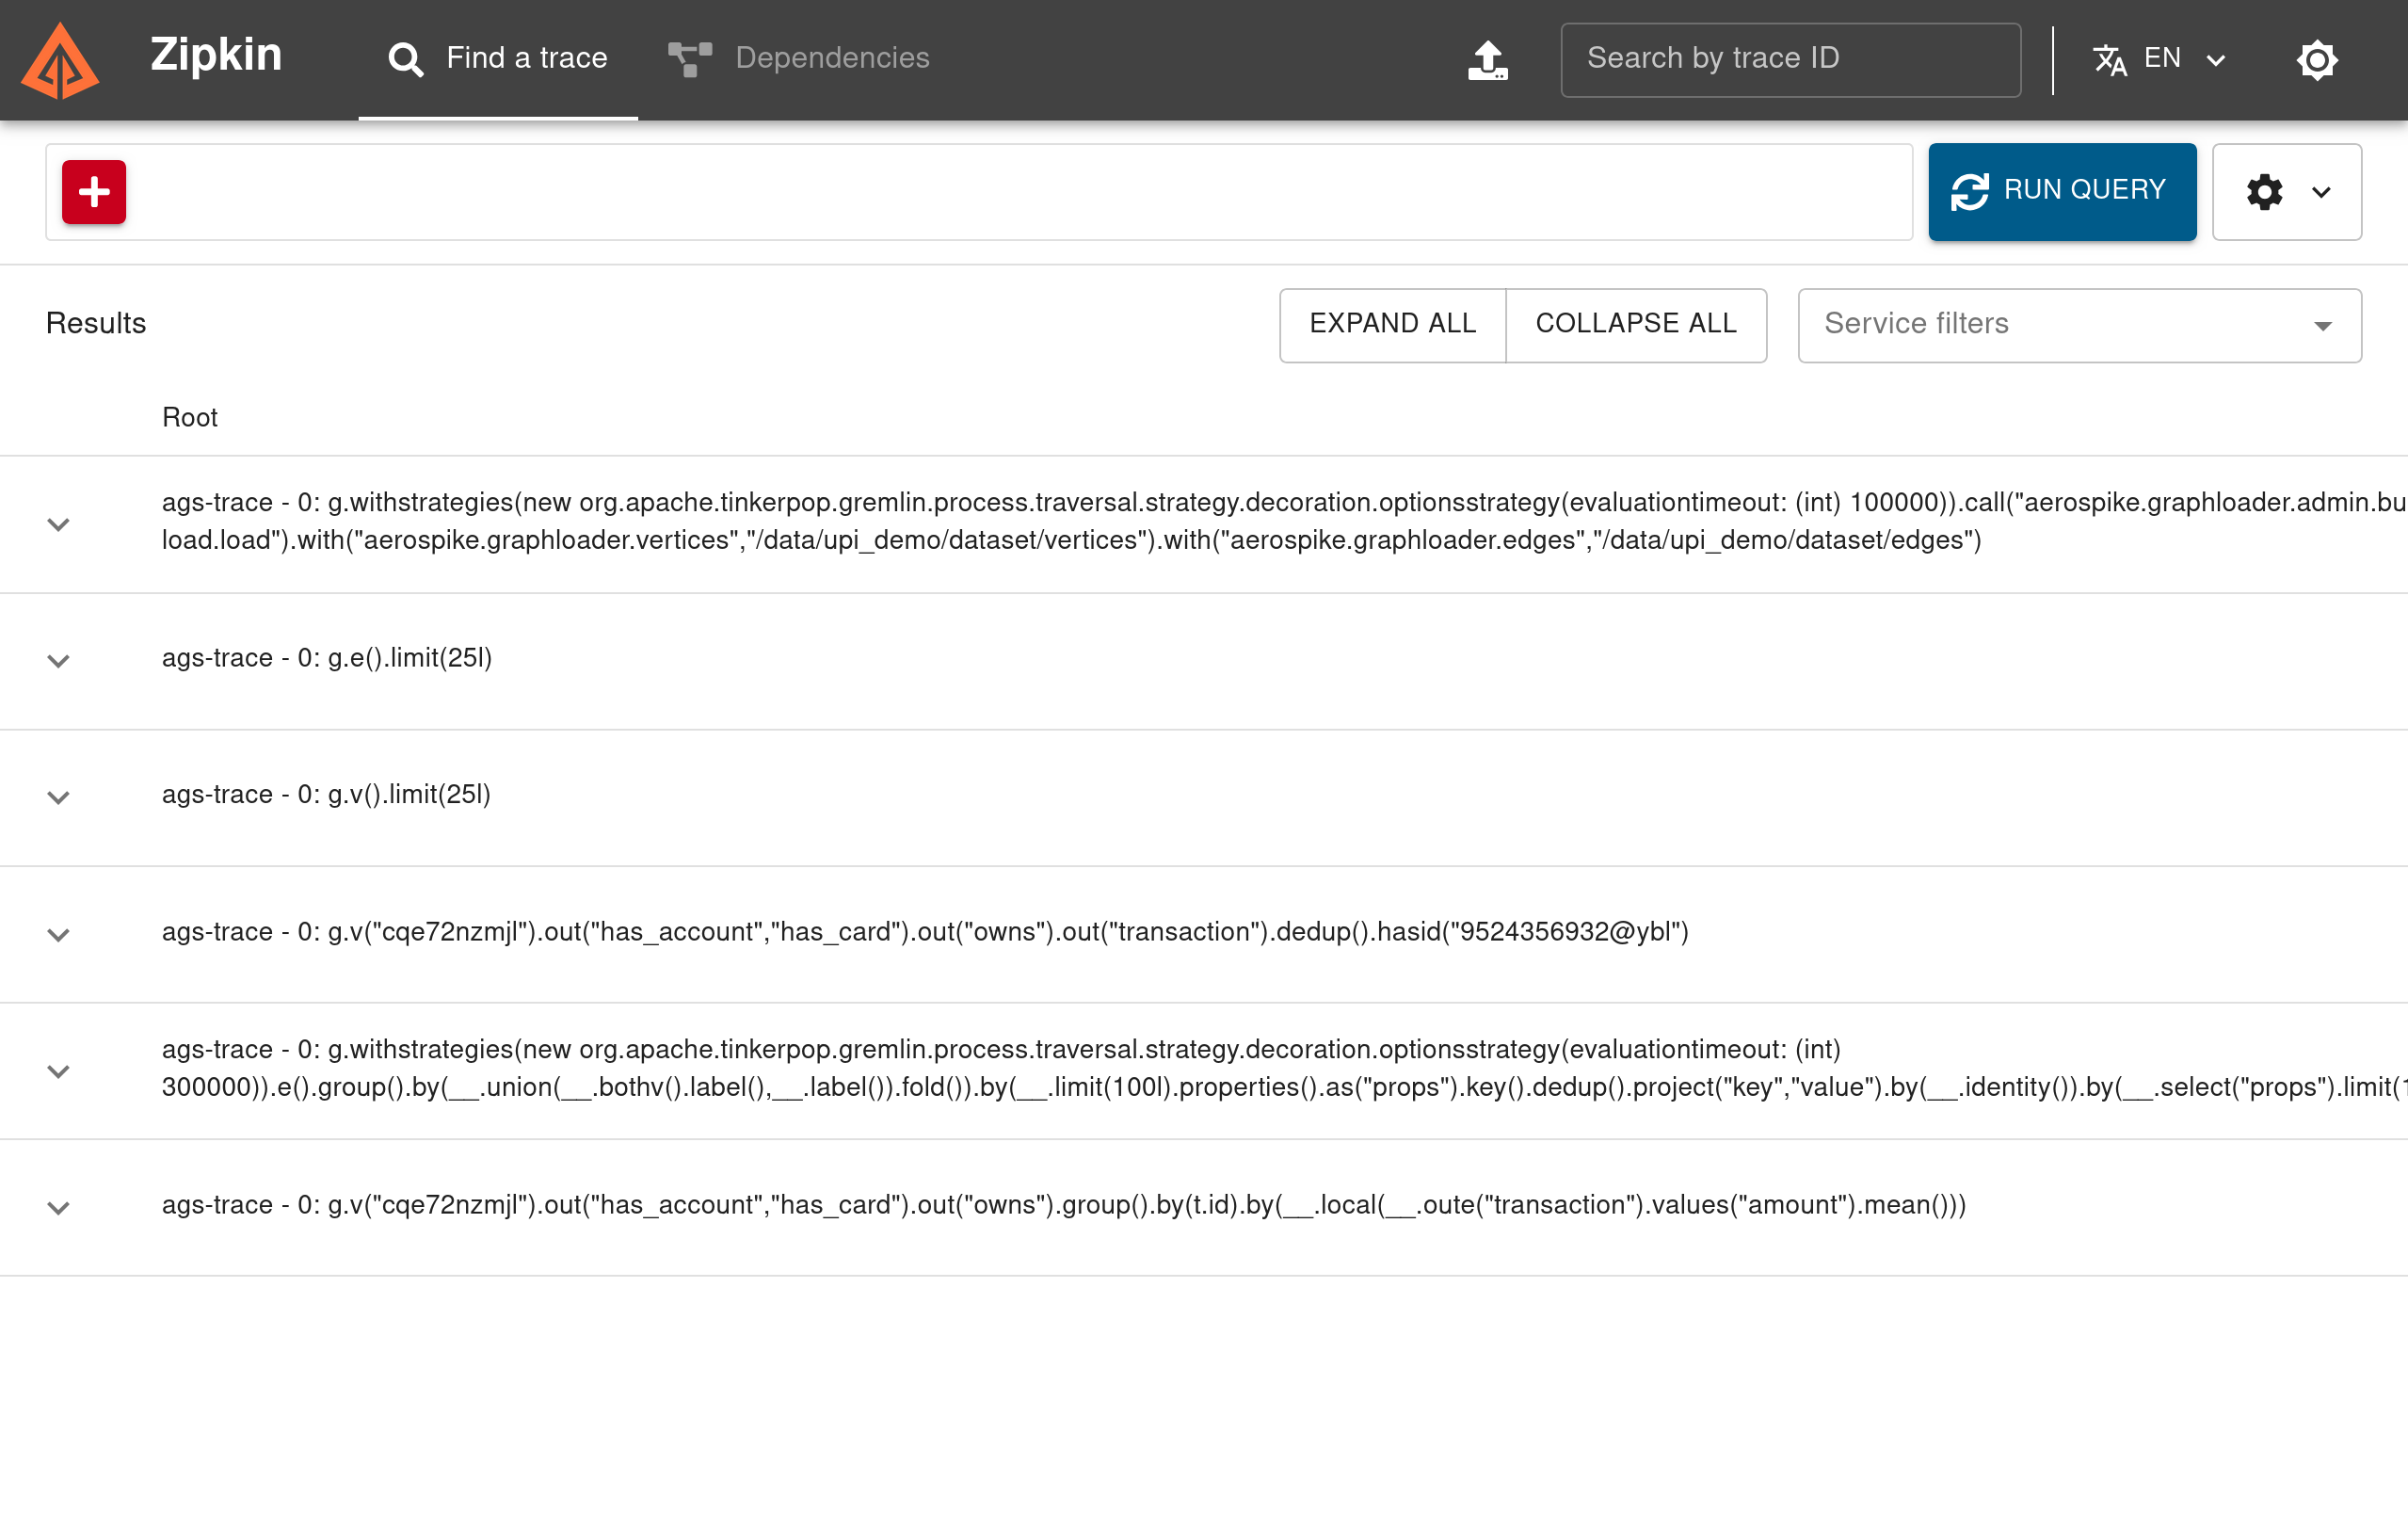
The following screenshot shows the Zipkin UI with some example queries:
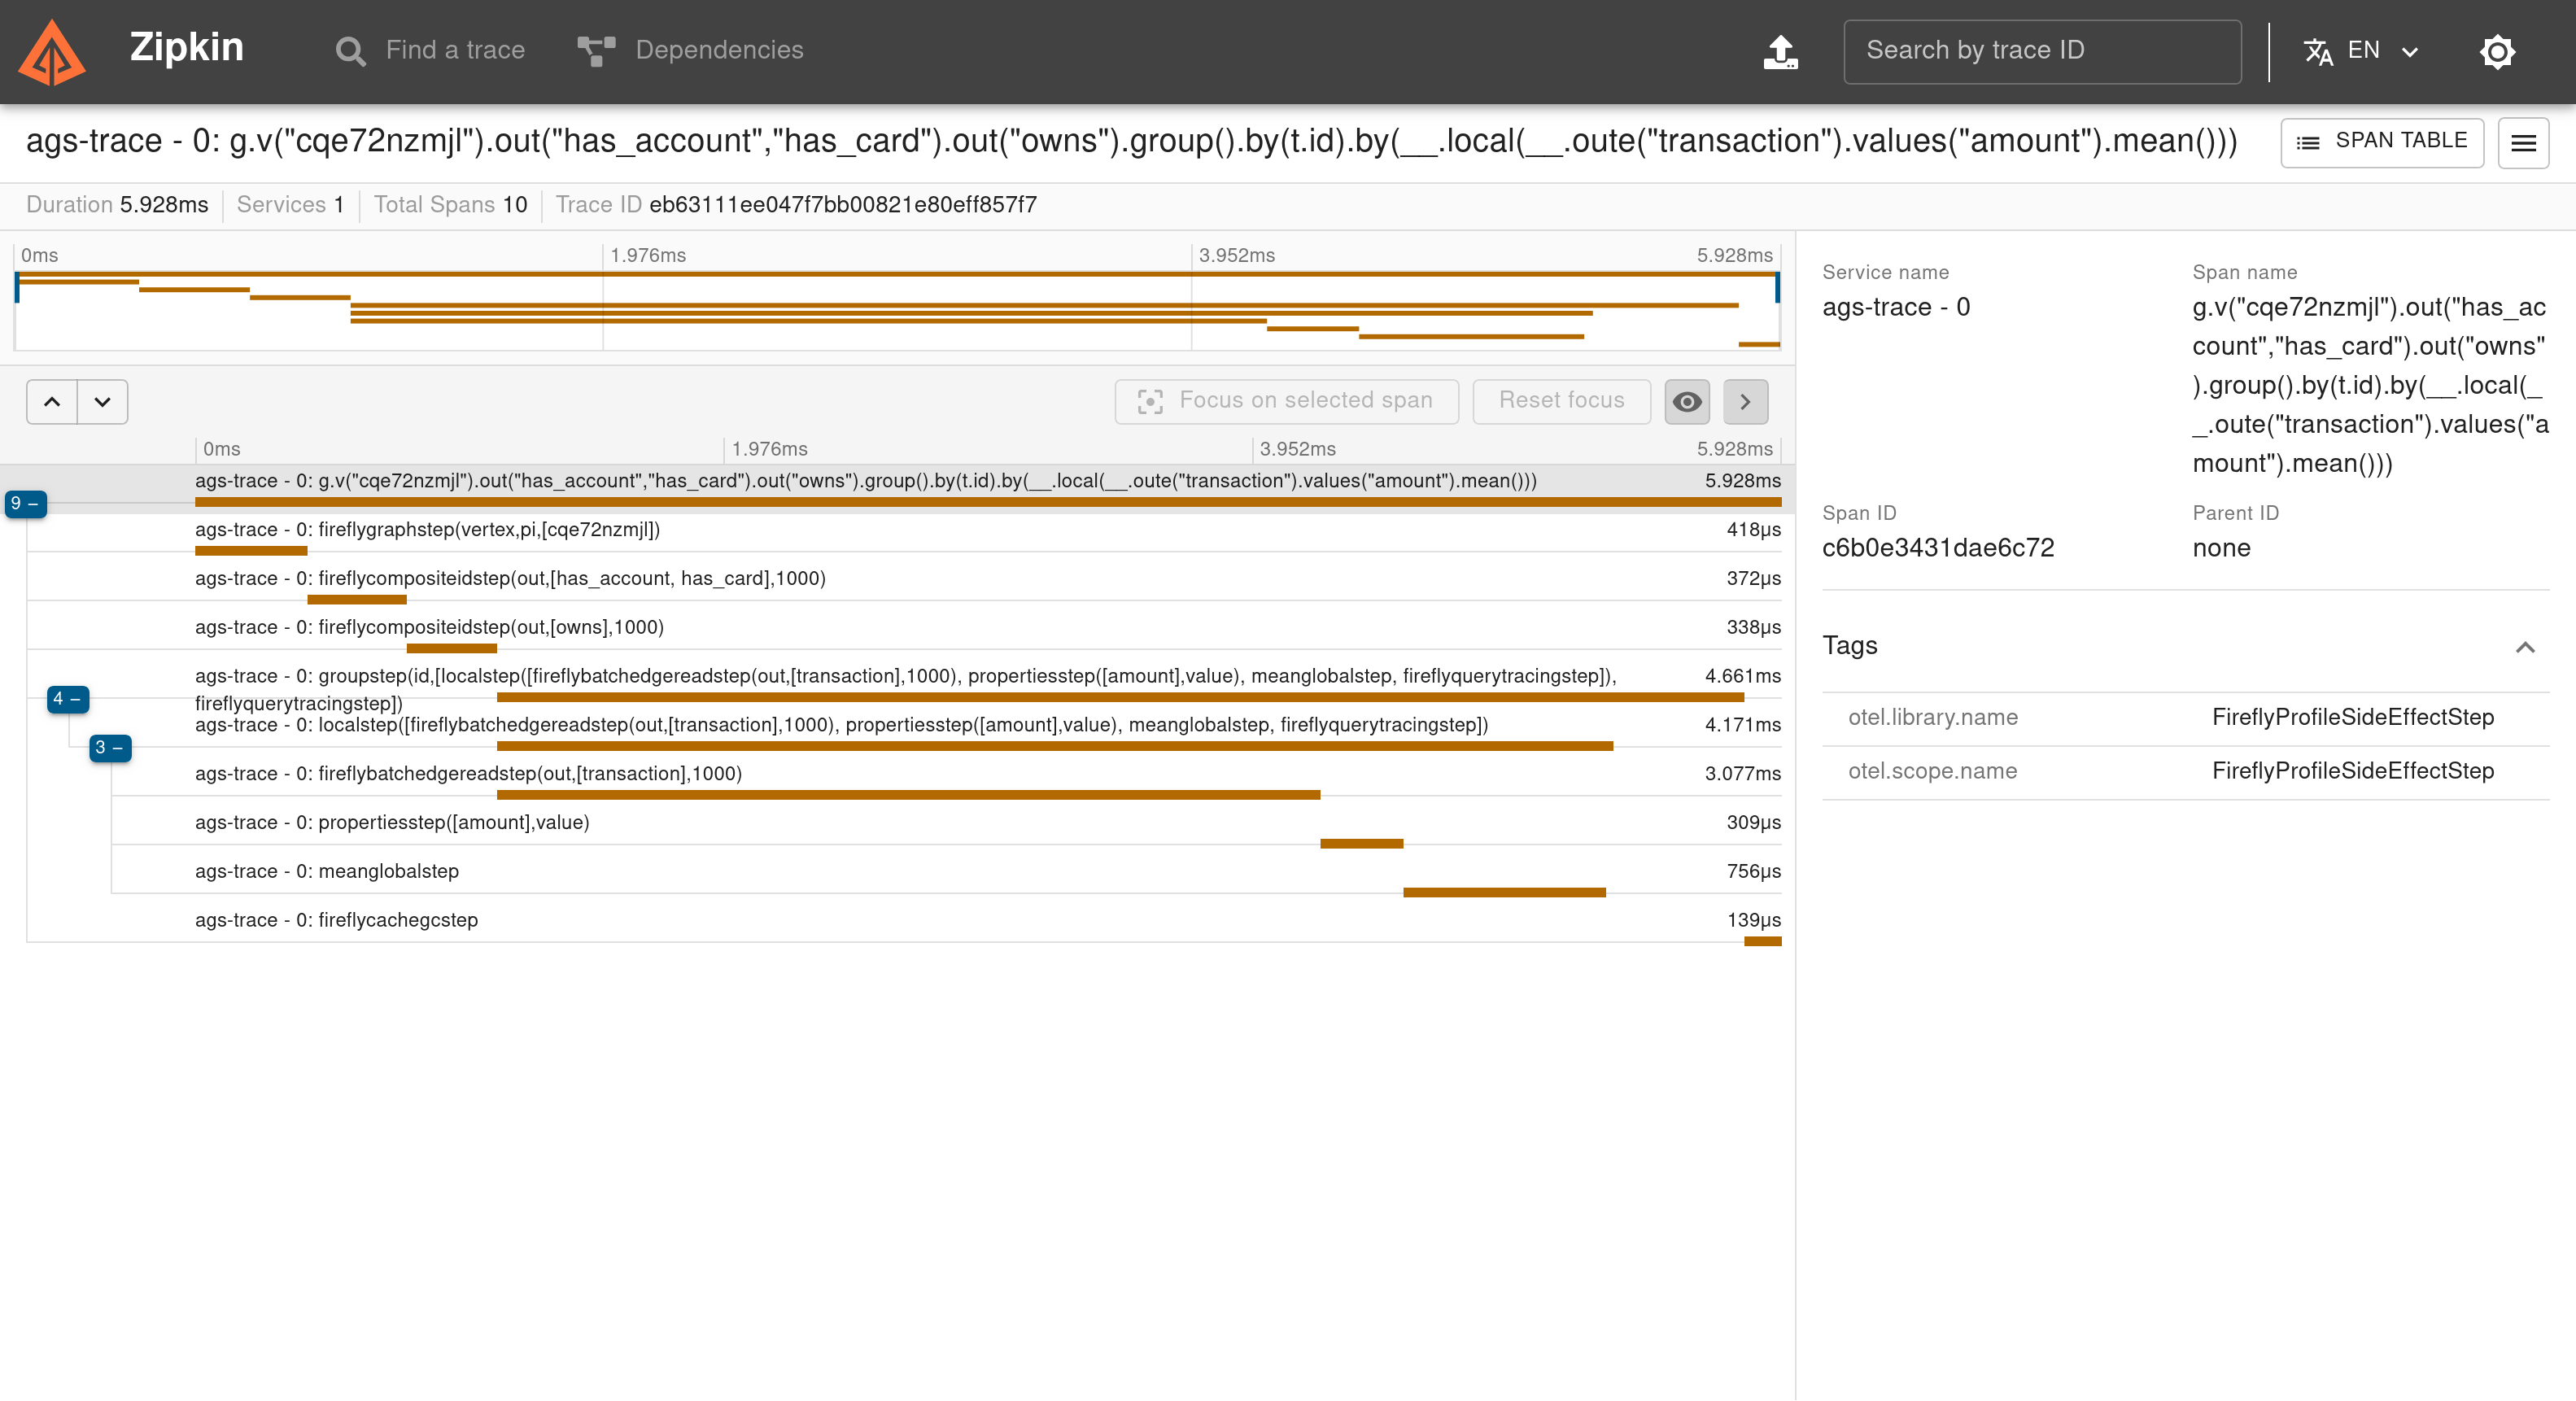
Click on a query to expand. The following screenshot shows a detailed query breakdown: