OTel Aerospike Monitoring Stack
This page describes how to use the OpenTelemetry (OTel) Collector to import monitoring data from an Aerospike Database cluster and export it to the infrastructure and application monitoring tools of your choice. You can also use the Aerospike Prometheus Exporter to scrape monitoring data from the cluster before processing by the OTel Collector.
Aerospike publishes Docker Compose configurations on GitHub that package the following Docker containers and configuration files:
These containers are assumed to run on the same host as a single-node Aerospike cluster.
- opentelemetry-collector-contrib - OpenTelemetry Collector, a vendor-agnostic tool that can ingest and export telemetry data in a wide variety of formats. Includes OTel Collector configuration files, in YAML format, for sending data to specific monitoring tools.
- aerospike-prometheus-exporter - Aerospike Prometheus Exporter, a tool that exposes Aerospike database metrics so that they can be scraped by Prometheus. This is included in the Docker Compose stack, but is not required for all workflows.
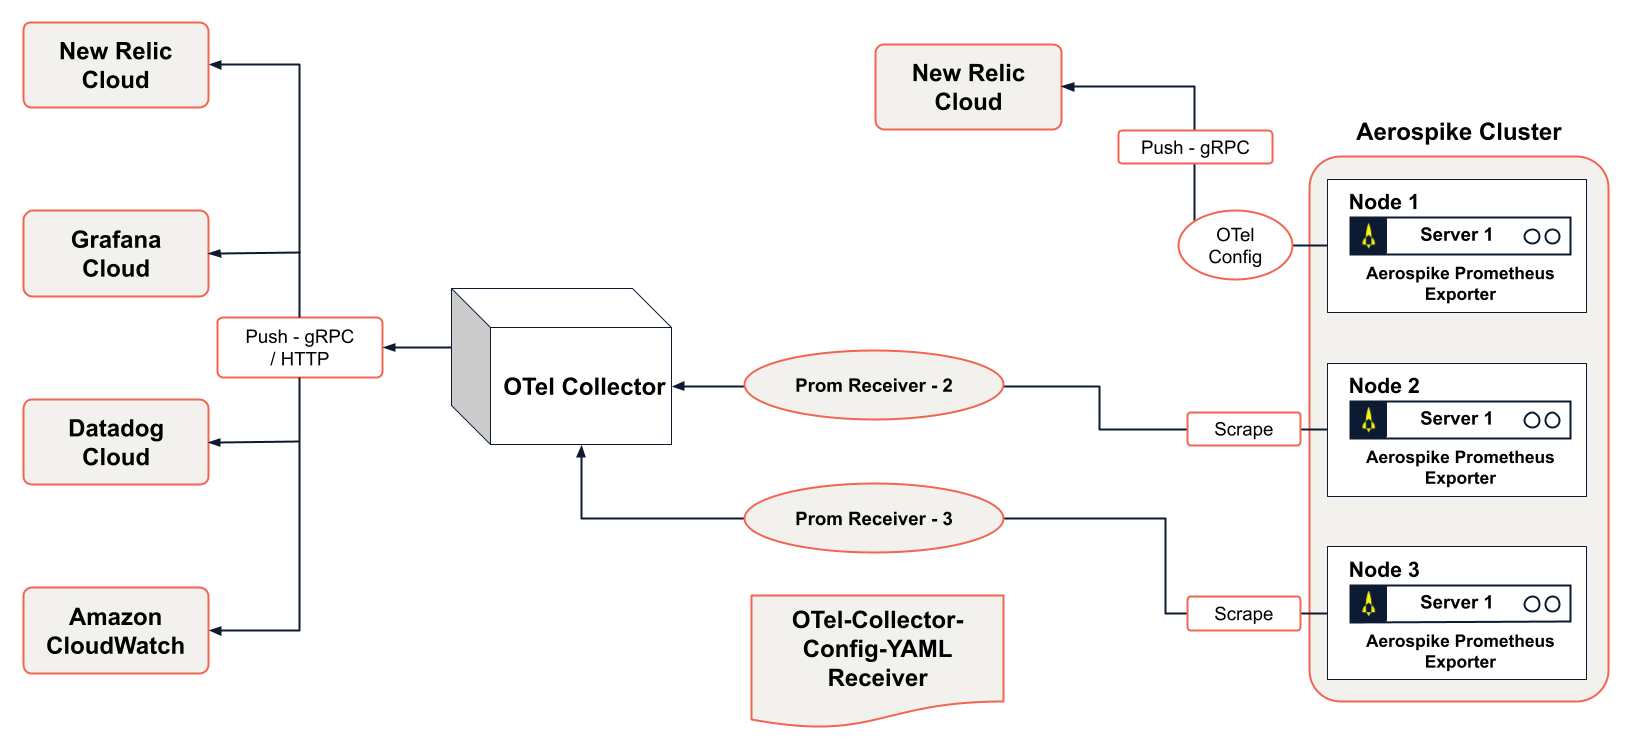
The following image illustrates the use of Aerospike Prometheus Exporter with various cloud endpoints. Aerospike provides example configuration files for the OTel Collector. Use these files as a guide for connecting to other endpoints that support data in the same format.
Prerequisites
A single-node Aerospike Database cluster with the service port accessible from port 3000 of the host where the Monitoring Stack is deployed. If you need a cluster for testing, you can deploy one in a container using the following Docker command:
$ docker run -tid --name aerospike -p 3000:3000 -p 3001:3001 -p 3002:3002 aerospike/aerospike-server-enterprise:latest
Aerospike Prometheus Exporter can push data to OTel endpoints through a direct connection to an OTel endpoint or by using the OTel Collector. The following sections describe these two approaches.
Configure a direct connection to OTel endpoints
Modify the Aerospike Prometheus Exporter ape.toml config file with the OTel endpoints.
Currently Exporter supports only gRPC endpoints.
Change the OTel configuration parameters under Agent.OpenTelemetry in ape.toml.
service_name = # application service to appear in the observability site
endpoint = # endpoint of the OTel provider without any protocol or port number
endpoint_tls_enabled = # boolean
headers = # mention the auth api-key as key=value pair here, multiple key/values can be provided as comma-separated values
Example:
service_name = "aerospike-cluster-checkout-system"
endpoint = "otlp.nr-data.net"
endpoint_tls_enabled = false
headers = {api-key="newrelic-auth-key"}
Configure the OTel Collector
The OTel collector passes data to a number of external endpoints defined in a configuration file.
Visit the OTel Aerospike Monitoring Stack GitHub page for example configuration files that you can use with the OTel Collector.
Update the API Key or Access Key in the respective configuration files.
New Relic
Modify newrelic-otel-collector-config.yml and update the following keys with the appropriate values for your deployment:
otlp:
    endpoint: https://otlp.nr-data.net:4317
    headers:
      api-key: NEWRELIC-API-KEY
To start the stack, run docker-compose -f newrelic-docker-compose.yml up. To stop the stack, run docker-compose -f newrelic-docker-compose.yml down. Visit New Relic cloud to see Aerospike metrics.
Datadog
Modify datadog-otel-collector-config.yml and update the following keys with the appropriate values for your deployment:
datadog:
    api:
        site: datadoghq.com
        key: DATADOG-APP-KEY
To start the stack, run docker-compose -f datadog-docker-compose.yml up. To stop the stack, run docker-compose -f datadog-docker-compose.yml down. Visit Datadog cloud to see Aerospike metrics.
DynaTrace
Modify dynatrace-otel-collector-config.yml and update the following keys with the appropriate values for your deployment:
dynatrace:
    prefix: as_dynatrace_demo
    endpoint:  https://YOUR-ENVIRONMENT-ID.live.dynatrace.com/api/v2/metrics/ingest
    api_token: DYNATRACE-APP-TOKEN
To start the stack, run docker-compose -f dynatrace-docker-compose.yml up. To stop the stack, run docker-compose -f dynatrace-docker-compose.yml down. Visit DynaTrace Cloud to see Aerospike metrics.
See OTel-DynaTrace-documentation
Amazon CloudWatch
Modify cloudwatch-docker-compose.yml and update the following keys with the appropriate values for your deployment:
AWS_REGION=AWS-REGION-LOCATION
AWS_ACCESS_KEY_ID=
AWS_SECRET_ACCESS_KEY=
To start the stack, run docker-compose -f cloudwatch-docker-compose.yml up. To stop the stack, run docker-compose -f cloudwatch-docker-compose.yml down. Visit Amazon CloudWatch to see Aerospike metrics.